Micro Shirasu-balloons / Name of sample: B-6-1
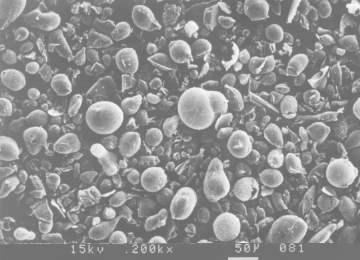 Fig. SEM photograph. |  Fig. Particle size distribution. |
Colors and whiteness.
| L | a | b | Whiteness (Lab) | Whiteness (Hunter) |
|---|---|---|---|---|
| 82.04 | 3.18 | 10.09 | 79.16 | 55.48 |
Mean diameter, Amount of particles floating after dispersed in water and Density.
| Mean diameter (µm) | Particles floating (wt%) | Particles floating after dispersed with ultra-sonic (wt%) | Particle density (g/cm3) | Bulk density (g/cm3) | Tapped bulk density (g/cm3) |
|---|---|---|---|---|---|
| 22.4 | 22.9 | 14.0 | 1.31 | 0.28 | 0.42 |
Strength (amount of nonfractured particles after compressing).
| Particle density before testing (g/cm3) | Particle density after uniaxial compressing at 5MPa (g/cm3) | Nonfractured particles after uniaxial compressing at 5MPa (wt%) | Particle density after hydrostatics compressing at 8MPa (g/cm3) | Nonfractured particles after hydrostatics compressing at 8MPa (wt%) |
|---|---|---|---|---|
| 1.31 | 1.55 | 65.0 | 1.34 | 94.9 |
|
| ||||||||||