XRD, TGA and TMA Charts (No.112)
| No. | Name | Sampling date | Vein or deposit | Mining place | Mining company | Sampling place | Grade or sort |
|---|---|---|---|---|---|---|---|
| 112 | KRT__03A | November 13,1982 | Tomioka D. | Shiroiwasaki | Kiyama Tohseki | Shiroiwasaki | Best quality, Low Fe |
| Colors of the milled samples | |||||||
|---|---|---|---|---|---|---|---|
| X | Y | Z | Whiteness (Hunter) | L | a | b | Whiteness (Lab) |
| 81.15 | 81.49 | 88.93 | 75.36 | 90.27 | 2.49 | 4.78 | 88.88 |
| Chemical compositions (wt%) | ||||||||
|---|---|---|---|---|---|---|---|---|
| SiO2 | Al2O3 | Fe2O3 | TiO2 | CaO | MgO | Na2O | K2O | Ig.loss |
| 75.01 | 15.03 | 0.43 | 0.05 | 0.12 | 0.35 | 3.47 | 4.32 | 1.14 |

| Mineral compositions (wt%) | |||||
|---|---|---|---|---|---|
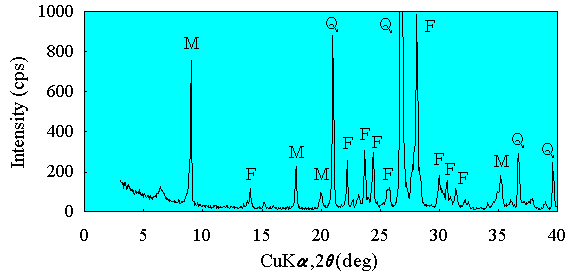
| Q : Quartz | M : Sericite | K : Kaolin mineral | F : Feldspar | C : Calcite | S : Siderite |
| 39.27 | 32.94 | 0.64 | 26.93 | 0.00 | 0.22 |

| Results of TGA and Colors of the Powder Samples after Measuring | |||||||||||||||||||||||||||||
|---|---|---|---|---|---|---|---|---|---|---|---|---|---|---|---|---|---|---|---|---|---|---|---|---|---|---|---|---|---|
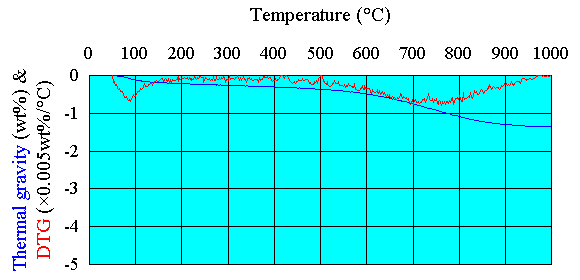
The conditions for TGA were sample weight : about 180mg, heating rate : 20°C/min, ended temperature : 1000°C.
LT : Total weight loss, L400 : Weight loss of 400-1000°C. LT (wt%) | L400 (wt%) | X | Y | Z | Whiteness (Hunter) | L | a | b | Whiteness (Lab)
| 1.35 | 1.05 | 77.14 | 76.94 | 77.42 | 65.61 | 87.72 | 3.48 | 9.07 | 84.34
| | |||||||||

| Results of TMA and Colors of the Sintered Samples after Measuring | ||||||||||||||||||||||||||||||||||||||||||||
|---|---|---|---|---|---|---|---|---|---|---|---|---|---|---|---|---|---|---|---|---|---|---|---|---|---|---|---|---|---|---|---|---|---|---|---|---|---|---|---|---|---|---|---|---|
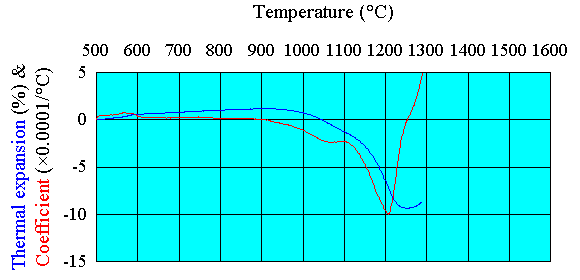
The conditions for TMA were compaction pressure : 250MPa, pellet diameter : 10mm, thickness : about 3mm, heating rate : 10°C/min, loading : 10g.
W10 : Contents of particles larger than 10µm, SMax : Maximum shrinkage, T0 : Temperature at the maximum shrinkage, T5 : Temperature at the expansion coefficient becomes 0.0005/°C, TS5 : Temperature rectified using the correlative equation, TSK : Nominal temperature equivalent to its SK. W10 | (wt%) SMax | (%) T0 | (°C) T5 | (°C) TS5 | (°C) TSK | (°C) SK | X | Y | Z | W | (Hunter) L | a | b | W | (Lab) 45.8 | 9.36 | 1251 | 1289 | 1285 | 1427 | 15- | 58.00 | 59.33 | 62.65 | 53.09 | 77.03 | -0.39 | 5.69 | 76.33
| | ||||||||||||||
| Back to the list of vein or deposit | Back to the list of grade or sort |