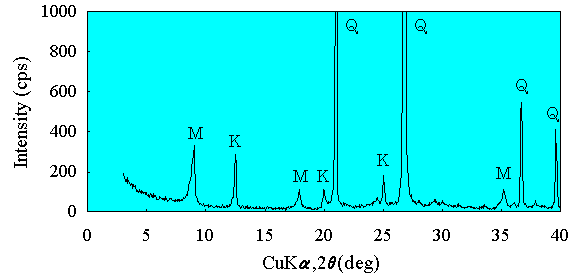
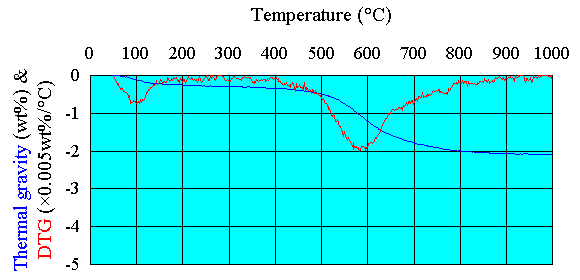
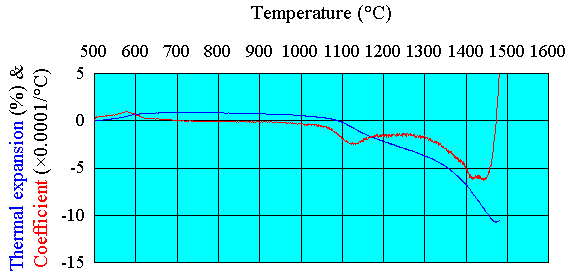
XRD, TGA and TMA Charts (No.044)
| No. | Name | Sampling date | Vein or deposit | Mining place | Mining company | Sampling place | Grade or sort |
|---|---|---|---|---|---|---|---|
| 044 | USI0_04S | July 16, 1980 | Sarayama V. | Iguchiyama | Ueda Tohseki | Cliff / right | Special grade |
| Colors of the milled samples | |||||||
|---|---|---|---|---|---|---|---|
| X | Y | Z | Whiteness (Hunter) | L | a | b | Whiteness (Lab) |
| 82.10 | 83.55 | 91.90 | 77.88 | 91.41 | 0.37 | 4.37 | 90.35 |
| Chemical compositions (wt%) | ||||||||
|---|---|---|---|---|---|---|---|---|
| SiO2 | Al2O3 | Fe2O3 | TiO2 | CaO | MgO | Na2O | K2O | Ig.loss |
| 85.26 | 10.08 | 0.27 | 0.01 | 0.00 | 0.10 | 0.09 | 2.21 | 1.84 |

| Mineral compositions (wt%) | |||||
|---|---|---|---|---|---|
| Q : Quartz | M : Sericite | K : Kaolin mineral | F : Feldspar | C : Calcite | S : Siderite |
| 69.67 | 21.55 | 8.28 | 0.50 | 0.00 | 0.00 |

| Results of TGA and Colors of the Powder Samples after Measuring | |||||||||||||||||||||||||||||
|---|---|---|---|---|---|---|---|---|---|---|---|---|---|---|---|---|---|---|---|---|---|---|---|---|---|---|---|---|---|
The conditions for TGA were sample weight : about 180mg, heating rate : 20°C/min, ended temperature : 1000°C.
LT : Total weight loss, L400 : Weight loss of 400-1000°C. LT (wt%) | L400 (wt%) | X | Y | Z | Whiteness (Hunter) | L | a | b | Whiteness (Lab)
| 2.09 | 1.76 | 71.68 | 69.12 | 62.14 | 52.66 | 83.14 | 8.41 | 13.88 | 76.60
| | |||||||||

| Results of TMA and Colors of the Sintered Samples after Measuring | ||||||||||||||||||||||||||||||||||||||||||||
|---|---|---|---|---|---|---|---|---|---|---|---|---|---|---|---|---|---|---|---|---|---|---|---|---|---|---|---|---|---|---|---|---|---|---|---|---|---|---|---|---|---|---|---|---|
The conditions for TMA were compaction pressure : 250MPa, pellet diameter : 10mm, thickness : about 3mm, heating rate : 10°C/min, loading : 10g.
W10 : Contents of particles larger than 10µm, SMax : Maximum shrinkage, T0 : Temperature at the maximum shrinkage, T5 : Temperature at the expansion coefficient becomes 0.0005/°C, TS5 : Temperature rectified using the correlative equation, TSK : Nominal temperature equivalent to its SK. W10 | (wt%) SMax | (%) T0 | (°C) T5 | (°C) TS5 | (°C) TSK | (°C) SK | X | Y | Z | W | (Hunter) L | a | b | W | (Lab) 48.3 | 10.7 | 1471 | 1481 | 1475 | 1610 | 27 | 66.56 | 68.12 | 77.11 | 65.35 | 82.53 | -0.49 | 2.38 | 82.37
| | ||||||||||||||
| Back to the list of vein or deposit | Back to the list of grade or sort |